Will the downward trend of BCH/USD forming on an 1-hour chart continue? Check out the crypto market analysis for the week commencing 23rd September 2019.
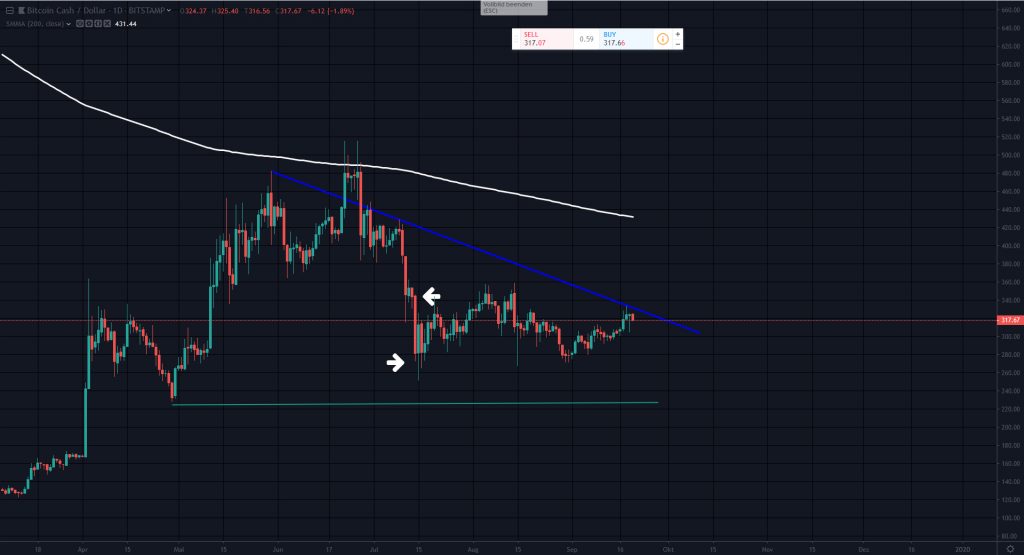
After the slide on 14th July this year, Bitcoin Cash (BCH) struggles with a variety of inner bars through a long-lasting sideways phase. After the two outbreaks at the top of the daily candlestick chart on 14th July and double testing the bottom, has not yet revealed a consistent picture on where the price is heading on the daily chart.
Personally, I tend to consider a price weakness right now, since it’s currently located below the 200 days Simple Moving Average (SMA), as the white line on the daily chart (1-day chart) shows. Therefore, it is not surprising that short-term sell-offs may be spotted. If extended, these sell-offs may push the BCH price down to the green support line at around USD 230. Almost like a textbook example, the Bitcoin Cash against the US Dollar course bounced off the blue resistance line, which leads me to suspect that we might see falling prices again in the coming days.
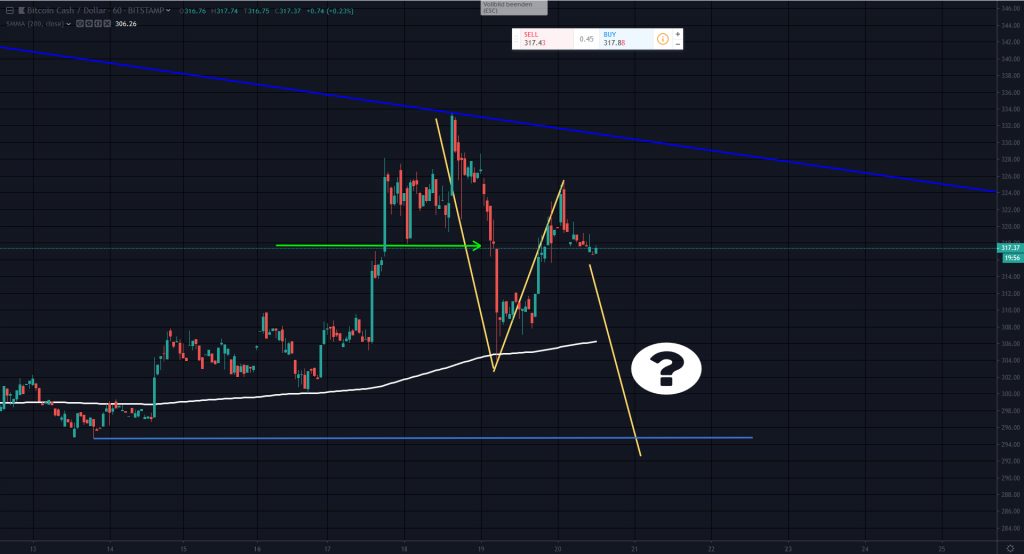
The hourly chart (1-hour chart) shows signs of the Bitcoin Cash price going bearish (see the trend break area marked with a green arrow). After the previous uptrend retraced from the dark blue resistance level, a descending pattern may be formed, leading to another instance of the Bitcoin Cash price heading south. That is pointed out in yellow, clearly showing a downtrend. Looking closely at the 1-hour chart, we may spot that the BCH price is currently supported by the 200 days Simple Moving Average line displayed in white. If this downtrend continues to develop in the coming days, the next support level will form at around USD 294, as marked in light blue on the hourly chart. Generally, the BCH/USD price is higher in the sideways phrase, but may offer opportunities for the sellers in the coming days.
What happens next with Bitcoin Cash? Will it head North or South? Share your opinion in the comments down below. Stick around for more weekly crypto market analyses – connect with CoinChoose.com on Twitter, Facebook, and LinkedIn now.
This market analysis should not be construed as investment or trading advice, nor a recommendation. It represents the author’s sole opinion. Prices should be considered indicative and may differ across market data providers. CoinChoose.com could not be held liable for any loss incurred by using this information.
Chart images: TradingView


