Will the uptrend forming on an hourly chart gain momentum in the long run? Bitcoin (BTC) analysis for the week commencing 9 September 2019. Read now.
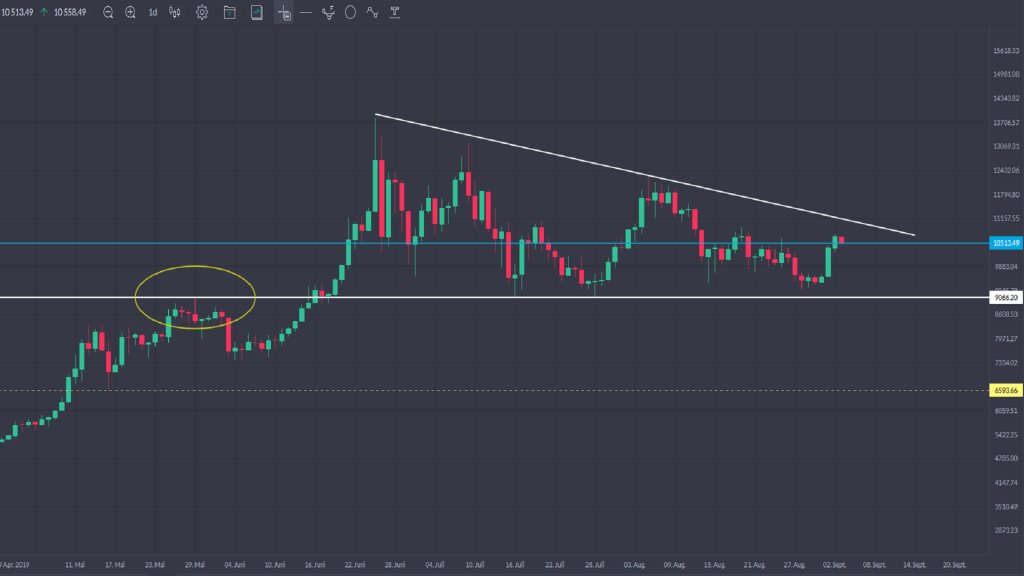
What Bitcoin (BTC) currently shows on a daily chart is not unusual after the impulsive upward movement it performed since April. This is a correction phase during which a classic triangle is formed (displayed in white on the daily chart below). Such patterns are typical breathers which give the traders and investors orientation on the market developments. Another signal that may justify the additional price increase may be given by a resistance breakout (the white line). In this context, traders and investors often look at previous highs, in this case the range between 13,168 and 13,829 as a target.
Another price increase would not be a surprise right now. For instance, in Germany alone, Bitcoin is penetrating more and more areas of everyday life. The fact that Burger King Germany cooperates with the delivery service Lieferando.de and offers Bitcoin as a payment method confirms this development. In the meantime, traders and investors may consider the horizontal line as support (also in white), which has been proven in conjunction with the high (yellow circle) of USD 9,065 at the end of May. Sustained breakout could eventually push Bitcoin’s price down to the USD 6,593 mark – the yellow support line.
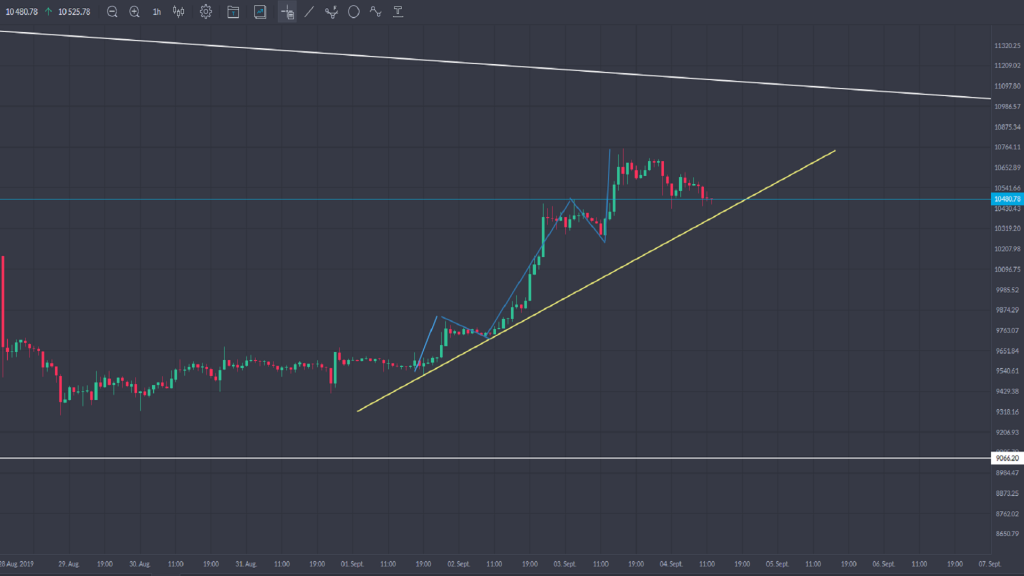
While boredom seems to prevail on the daily chart, interesting developments may be found on smaller time frames. We can spot this on the 1-hour chart, where an intact upward trend has developed (the blue lines on the 1-hour chart below). Although the movement was slowing down a bit and developed a correction pattern, the picture shows that the price is slowly approaching the (yellow) uptrend line.
If the trend continues to develop, the next challenge may be the white downward resistance line in the upper part of the 1-hour chart, which has been transferred from the daily chart.
In conclusion, little patience is required until the trend direction is displayed on a daily chart, while on smaller time frames Bitcoin forms prominent trend patterns.
What will happen with the price of Bitcoin? Will it go bullish or bearing? Leave your opinion in the comments down below. Tune in for more weekly crypto market analyses – join CoinChoose.com on Twitter, Facebook, and LinkedIn now.
This market analysis should not be construed as investment or trading advice, nor a recommendation. It represents the author’s sole opinion. Prices should be considered indicative and may differ across market data providers. CoinChoose.com could not be held liable for any loss incurred by using this information.
Chart images: Trading 212


